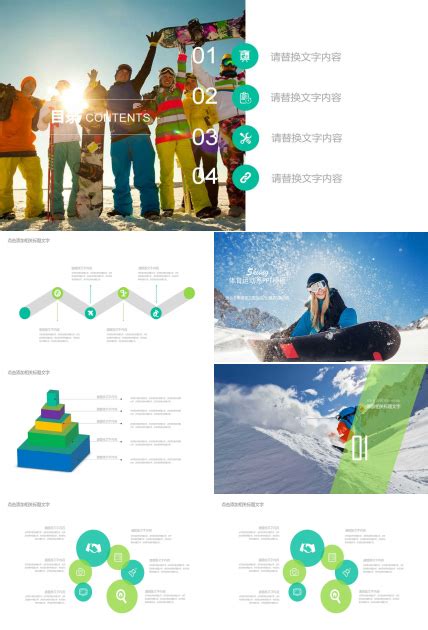
体育赛事分析
Title: Maximizing Impact: A Comprehensive Guide to Sports Event Analysis in PowerPoint
Introduction
In today's sports landscape, analyzing events is crucial for understanding performance, making informed decisions, and driving success. Utilizing PowerPoint for sports event analysis offers a dynamic platform to present data, insights, and strategies effectively. This comprehensive guide will outline the key steps and considerations for creating impactful sports event analysis presentations using PowerPoint.
1. Define Objectives and Scope
Before diving into analysis, clearly define the objectives and scope of your presentation. Consider the purpose of the analysis—are you evaluating team performance, individual player statistics, or audience engagement? Understanding the goals will guide your data collection and analysis process.
2. Gather Data
Collect relevant data from various sources such as official statistics websites, performance tracking systems, and social media platforms. Ensure the accuracy and reliability of the data to maintain credibility in your analysis. Data points may include:
Team/player statistics (e.g., goals scored, assists, shooting accuracy)
Game footage or highlights
Audience demographics and engagement metrics
Comparative analysis with competitors or historical performance
3. Organize Information
Structure your PowerPoint presentation in a clear and logical manner to facilitate understanding. Consider organizing sections such as:
Introduction: Brief overview of the event and its significance
Methodology: Explanation of data collection methods and analysis techniques
Key Findings: Presentation of insights derived from the analysis
Recommendations: Actionable suggestions based on the findings
Conclusion: Summary of the analysis and its implications
4. Visualize Data Effectively
Utilize charts, graphs, and visuals to present data in a visually appealing and comprehensible format. PowerPoint offers various tools for data visualization, including:
Bar charts: Compare performance metrics across teams or players
Line graphs: Illustrate trends and patterns over time (e.g., scoring trends throughout the season)
Pie charts: Display distribution of key metrics (e.g., possession percentage)
Heatmaps: Visualize spatial analysis (e.g., player movement on the field)

Ensure that visuals are clear, concise, and aligned with the key messages of your analysis.
5. Incorporate Multimedia Elements
Enhance your presentation with multimedia elements such as videos, images, and audio clips. Incorporating game highlights, player interviews, or fan reactions can provide context and engagement to your analysis. Be mindful of copyright restrictions when using multimedia content.
6. Provide Actionable Insights
Go beyond presenting data by offering actionable insights and recommendations. Identify areas of improvement, strategic opportunities, and potential threats based on the analysis. Tailor recommendations to specific stakeholders, whether it be coaches, players, management, or sponsors.
7. Engage Your Audience
Deliver your presentation in a dynamic and engaging manner to captivate your audience. Utilize storytelling techniques, interactive elements, and compelling visuals to maintain interest and convey your message effectively. Encourage audience participation through Q&A sessions or interactive polls.
8. Iterate and Improve
Continuous improvement is key to refining your sports event analysis presentations. Solicit feedback from stakeholders, evaluate the effectiveness of your analysis, and identify areas for enhancement. Iterate on your approach based on lessons learned and emerging trends in sports analytics.
Conclusion
Sports event analysis in PowerPoint offers a powerful platform for synthesizing data, extracting insights, and driving informed decisionmaking. By following the steps outlined in this guide, you can create impactful presentations that maximize the value of your analysis and drive success in the competitive world of sports. Embrace creativity, leverage technology, and strive for continuous improvement to stay ahead of the game.
免责声明:本网站部分内容由用户上传,若侵犯您权益,请联系我们,谢谢!联系QQ:2760375052


